Danh mục sản phẩm

Test thử giám sát thiết bị mạng bằng SNMP với Prometheus, Grafana và Docker
Giám sát thiết bị mạng bằng SNMP với Prometheus, Grafana và Docker
Để giám sát thiết bị mạng, các hệ thống giám sát đều dựa vào SNMP để thu thập số liệu (metric). Prometheus cũng vậy: nó dùng snmp_exporter để lấy metric từ thiết bị mạng. Vì thế, thiết bị nào hỗ trợ SNMP thì Prometheus đều thu thập được. Tuy nhiên giao diện của Prometheus khá đơn giản và thiếu trực quan, nên ta dùng thêm Grafana để hiển thị dạng dashboard.
Bài này là một bài test thực tế, toàn bộ chạy bằng Docker.
⚡ Tóm tắt nhanh
- Mục tiêu: giám sát thiết bị mạng (ở đây là AP Ruckus R700) qua SNMP, hiển thị bằng Grafana.
- Công cụ: snmp_exporter, Prometheus, Grafana, chạy trong 3 container Docker.
- Cách chạy: một file
docker-compose.ymlvà một fileprometheus.yml. - Thời gian thực hiện: khoảng 15–30 phút nếu Docker đã cài sẵn.
1. Mô hình và thành phần của bài test
Bài test gồm 5 thành phần:
| # | Thành phần | Vai trò | Trong bài test |
|---|---|---|---|
| 1 | snmp_exporter | Hỏi thiết bị qua SNMP và đổi kết quả thành metric | Container, cổng 9116 |
| 2 | Prometheus | Thu thập và lưu trữ metric | Container, cổng 9090 |
| 3 | Grafana | Vẽ biểu đồ, dashboard | Container, cổng 3000 |
| 4 | Thiết bị mạng cần giám sát | Đã bật SNMP | AP Ruckus R700, IP 192.168.0.11 |
| 5 | Máy tính cài Docker | Chạy 3 container | Windows 10, IP 192.168.0.17, dùng Docker Desktop |
Luồng dữ liệu:
Thiết bị mạng ──SNMP──▶ snmp_exporter ──metric──▶ Prometheus ──▶ Grafana
(192.168.0.11)          (cổng 9116)               (cổng 9090)    (cổng 3000)
💡 Trước khi bắt đầu, nếu chưa nắm SNMP là gì, xem SNMP là gì, SNMP hoạt động như thế nào? hoặc Bài 69 CCNA: SNMP. Thiết bị cần giám sát phải bật SNMP trước và cho phép địa chỉ máy Docker (192.168.0.17) truy vấn.
2. Các bước thực hiện
Bước 1: Cài Docker Desktop trên Windows 10
Cài Docker Desktop trên máy Windows 10 (IP: 192.168.0.17) theo hướng dẫn Docker for Windows install, dùng WSL 2 backend.
Bước 2: Khởi động Docker Desktop
Mở ứng dụng Docker Desktop và chờ đến khi Docker báo trạng thái đang chạy.

Bước 3: Pull 3 image: snmp_exporter, Prometheus, Grafana
Mở CMD và chạy lần lượt:
C:\Users\Tuan>docker pull prom/snmp-exporter
C:\Users\Tuan>docker pull prom/prometheus
C:\Users\Tuan>docker pull grafana/grafana
Kiểm tra đã có đủ 3 image bằng lệnh docker image ls:
C:\Users\Tuan>docker image ls

REPOSITORY           TAG       IMAGE ID       CREATED        SIZE

grafana/grafana      latest    e511606aee56   4 weeks ago    206MB

prom/prometheus      latest    9dfc442be98c   6 weeks ago    189MB

prom/snmp-exporter   latest    2a81c3a85a13   6 months ago   19.7MB
Bước 4: Tạo project grafana và file docker-compose.yml
Tạo một thư mục project tên grafana (trong bài là C:\Users\Tuan\.docker\grafana) và tạo file docker-compose.yml bên trong

và tạo file docker-compose.yml; với nội dung thí dụ như:
version: '3.9'
volumes:

  snmp:

  grafa:

  prome:

  prome-data:

services:

  prometheus:

    image: prom/prometheus

    volumes:

      - prome:/etc/prometheus

      - prome-data:/prometheus

    expose:

      - 9090

    ports:

      - 9090:9090

    depends_on:

      - snmp-exporter


  snmp-exporter:

    image: prom/snmp-exporter

    volumes:

      - snmp:/etc/snmp_exporter

    expose:

      - 9116

    ports:

      - 9116:9116


  grafana:

    image: grafana/grafana

    depends_on:

      - prometheus

    expose:

      - 3000

    ports:

      - 3000:3000

    volumes:

      - grafa:/var/lib/grafana
Giải thích file này:
| Phần | Ý nghĩa |
|---|---|
volumes: ở đầu file |
Khai báo 4 volume để lưu dữ liệu và cấu hình, không mất khi xóa container: snmp (cấu hình snmp_exporter), grafa (dữ liệu Grafana), prome (cấu hình Prometheus), prome-data (dữ liệu metric Prometheus). |
ports: 9090:9090 |
Mở cổng ra máy host để truy cập từ trình duyệt (cổng máy host : cổng container). |
depends_on |
Thứ tự khởi động: snmp-exporter → Prometheus → Grafana. |
/etc/prometheus |
Thư mục chứa file cấu hình prometheus.yml bên trong container. |
Bảng cổng của 3 dịch vụ:
| Dịch vụ | Cổng | Địa chỉ truy cập |
|---|---|---|
| snmp_exporter | 9116 | http://192.168.0.17:9116 |
| Prometheus | 9090 | http://192.168.0.17:9090 |
| Grafana | 3000 | http://192.168.0.17:3000 |
ℹ️ Docker Compose bản mới có thể cảnh báo dòng
versionlà lỗi thời (obsolete). Cảnh báo này không ảnh hưởng đến hoạt động, có thể xóa dòng đó đi.
Bước 5: Chạy docker-compose
Trong thư mục project, chạy:
C:\Users\Tuan\.docker\grafana>docker-compose up
Nếu thành công sẽ thấy log khởi động của cả 3 container:
C:\Users\Tuan\.docker\grafana>docker-compose up

Starting grafana_snmp-exporter_1 ... done

Starting grafana_prometheus_1    ... done

Starting grafana_grafana_1       ... done

Attaching to grafana_snmp-exporter_1, grafana_prometheus_1, grafana_grafana_1

prometheus_1     | level=info ts=2021-08-13T02:21:58.713Z caller=main.go:389 msg="No time or size retention was set so using the default time retention" duration=15d

prometheus_1     | level=info ts=2021-08-13T02:21:58.714Z caller=main.go:443 msg="Starting Prometheus" version="(version=2.28.1, branch=HEAD, revision=b0944590a1cdc5a696869f75f422b107a1)"

prometheus_1     | level=info ts=2021-08-13T02:21:58.714Z caller=main.go:448 build_context="(go=go1.16.5, user=root@2915dd495090, date=20210701-15:20:10)"

prometheus_1     | level=info ts=2021-08-13T02:21:58.714Z caller=main.go:449 host_details="(Linux 5.10.16.3-microsoft-standard-WSL2 #1 SMP Fri Apr 2 22:23:49 UTC 2021 x86_64 93b2a752f299 localdomain)"

prometheus_1     | level=info ts=2021-08-13T02:21:58.714Z caller=main.go:450 fd_limits="(soft=1048576, hard=1048576)"

prometheus_1     | level=info ts=2021-08-13T02:21:58.714Z caller=main.go:451 vm_limits="(soft=unlimited, hard=unlimited)
ℹ️ Với Docker mới, lệnh có thể là
docker compose up(có dấu cách thay vì dấu gạch ngang). Thêm-dđể chạy nền.
Nếu container Prometheus báo lỗi khi khởi tạo: nguyên nhân là chưa có file prometheus.yml. Cách xử lý:
- Dừng docker-compose bằng tổ hợp phím Ctrl + C.
- Vào volume
grafana_promemà Docker vừa tạo (có thể xem trong mục Volumes của Docker Desktop). - Tạo file
prometheus.ymlvới nội dung cơ bản bên dưới

# my global config

global:

  scrape_interval:     15s # Set the scrape interval to every 15 seconds. Default is every 1 minute.

  evaluation_interval: 15s # Evaluate rules every 15 seconds. The default is every 1 minute.

  # scrape_timeout is set to the global default (10s).


# Alertmanager configuration

alerting:

  alertmanagers:

  - static_configs:

    - targets:

      # - alertmanager:9093


# Load rules once and periodically evaluate them according to the global 'evaluation_interval'.

rule_files:

  # - "first_rules.yml"

  # - "second_rules.yml"


# A scrape configuration containing exactly one endpoint to scrape:

# Here it's Prometheus itself.

scrape_configs:

  # The job name is added as a label `job=<job_name>` to any timeseries scraped from this config.

  - job_name: 'snmp'

    static_configs:

      - targets:

        - 192.168.0.11 # địa chỉ của thiết bị cần giám sát

    metrics_path: /snmp

    params:

      module: [if_mib]

    relabel_configs:

      - source_labels: [__address__]

        target_label: __param_target

      - source_labels: [__param_target]

        target_label: instance

      - target_label: __address__

        replacement: 192.168.0.17:9116 # địa chỉ IP của máy host
Sau đó chạy lại docker-compose up.
Giải thích phần cấu hình quan trọng nhất (job snmp):
| Dòng | Ý nghĩa |
|---|---|
targets: 192.168.0.11 |
IP thiết bị cần giám sát. Muốn thêm thiết bị, thêm IP vào danh sách này. |
metrics_path: /snmp |
Prometheus gọi vào đường dẫn /snmp của snmp_exporter, thay vì /metrics mặc định. |
module: [if_mib] |
Module SNMP dùng để lấy dữ liệu. if_mib lấy thông tin các cổng/interface: trạng thái, lưu lượng vào/ra, lỗi. |
relabel_configs |
Ba dòng này chuyển địa chỉ thiết bị thành tham số target gửi cho exporter, giữ nguyên IP thiết bị trong nhãn instance, và trỏ yêu cầu thật sự về 192.168.0.17:9116. |
replacement: 192.168.0.17:9116 |
Địa chỉ snmp_exporter, tức IP máy host chạy Docker. |
⚠️ Lưu ý khi dùng snmp_exporter bản mới (từ v0.23 trở lên): ngoài
yamlmodule, cần khai báo thêmauthtrong phầnparams, ví dụ:params: auth: [public_v2] module: [if_mib]Auth
public_v2dùng community mặc định làpublic. Nếu thiết bị dùng community khác, cần cấu hình lại trong filesnmp.ymlcủa snmp_exporter (xem tài liệu tại github.com/prometheus/snmp_exporter). Bản snmp_exporter đời cũ (như lúc làm bài test này) không cần dòngauth.
Bước 6: Kiểm tra và chạy thử
Kiểm tra lần lượt từng thành phần theo thứ tự snmp_exporter → Prometheus → Grafana.
6.1. Kiểm tra snmp_exporter
Mở trình duyệt, vào http://192.168.0.17:9116, nhập địa chỉ thiết bị SNMP (192.168.0.11) rồi bấm Submit. Nếu hiện danh sách metric là exporter đã lấy được dữ liệu từ thiết bị.

6.2. Kiểm tra Prometheus
Vào http://192.168.0.17:9090, kiểm tra Prometheus đã nhận metric (có thể xem trong Status → Targets, target snmp ở trạng thái UP).

6.3. Khởi chạy Grafana
Vào http://192.168.0.17:3000, đăng nhập bằng tài khoản mặc định admin / admin (Grafana sẽ yêu cầu đổi mật khẩu).

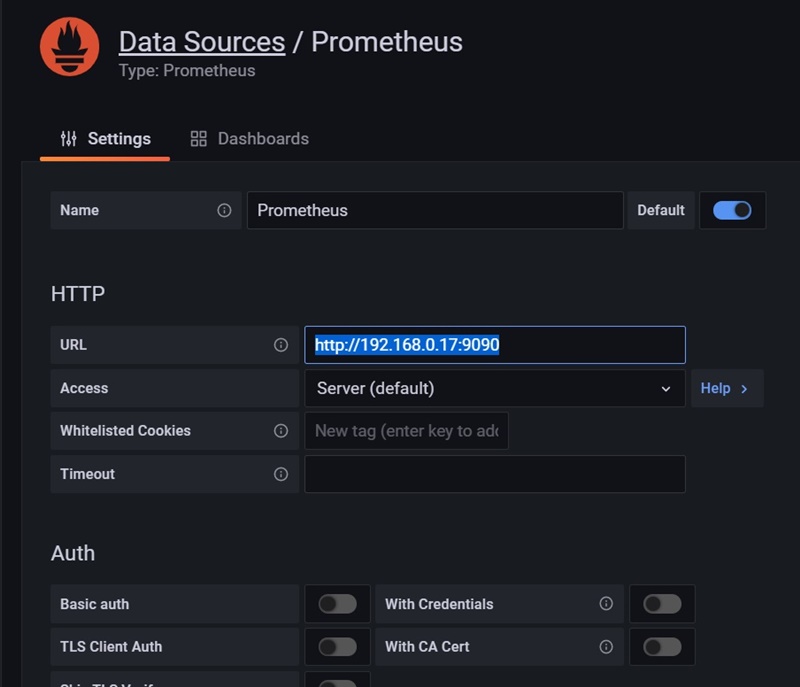
Thêm data source: chọn Add data source và chọn Prometheus.

Điền địa chỉ của Prometheus server (ví dụ http://192.168.0.17:9090) rồi bấm Save & test (apply/save)
Bước 7: Hiển thị trên Dashboard Grafana
Có hai cách tạo dashboard:
| Cách | Mô tả |
|---|---|
| Tạo mới | Tự tạo Dashboard và viết truy vấn cho từng biểu đồ. |
| Import có sẵn | Tải dashboard dựng sẵn từ grafana.com/grafana/dashboards rồi chỉnh sửa cho phù hợp với thiết bị của bạn. Cách này nhanh hơn cho người mới. |

Kết quả:

3. Lỗi thường gặp
| Hiện tượng | Nguyên nhân thường gặp | Cách xử lý |
|---|---|---|
| Container Prometheus báo lỗi khi khởi động | Chưa có file prometheus.yml |
Tạo file trong volume grafana_prome như hướng dẫn ở Bước 5 |
| Trang snmp_exporter không có dữ liệu | Thiết bị chưa bật SNMP, sai community hoặc ACL chặn IP máy Docker | Kiểm tra cấu hình SNMP trên thiết bị |
Target snmp ở trạng thái DOWN |
Sai IP exporter trong replacement hoặc firewall chặn cổng 9116 |
Kiểm tra IP máy host và mở cổng |
Báo lỗi về auth |
Dùng snmp_exporter bản mới nhưng thiếu auth trong params |
Thêm auth: [public_v2] như mục lưu ý ở Bước 5 |
| Grafana không có dữ liệu | Sai địa chỉ Prometheus ở data source | Kiểm tra lại URL và bấm Save & test |
4. Câu hỏi thường gặp
snmp_exporter là gì? Là chương trình trung gian chuyển dữ liệu SNMP của thiết bị thành metric mà Prometheus đọc được.
Prometheus có giám sát được thiết bị mạng không? Có, thông qua snmp_exporter. Mọi thiết bị hỗ trợ SNMP đều thu thập được.
Vì sao cần cả Grafana? Prometheus tập trung vào thu thập và lưu trữ dữ liệu, giao diện biểu đồ đơn giản. Grafana cung cấp dashboard trực quan, dễ tùy biến.
Có thể giám sát nhiều thiết bị cùng lúc không? Có. Thêm IP các thiết bị vào mục targets trong prometheus.yml.
Nên dùng Prometheus/Grafana hay Zabbix? Prometheus/Grafana mạnh về dashboard nhưng cần tự ghép nhiều thành phần. Zabbix có sẵn mọi thứ trong một. Xem hướng dẫn Zabbix để so sánh.
Xem thêm
- Bài 69 CCNA: SNMP – giám sát thiết bị mạng từ xa
- SNMP là gì, SNMP hoạt động như thế nào?
- Hướng dẫn cài đặt Zabbix giám sát thiết bị mạng
- Giám sát bằng Cacti
- Mạng không dây Cisco · Switch Cisco
VNExperts tư vấn và triển khai hệ thống giám sát mạng. Liên hệ: 0989 069 456 · sales@vnexperts.vn